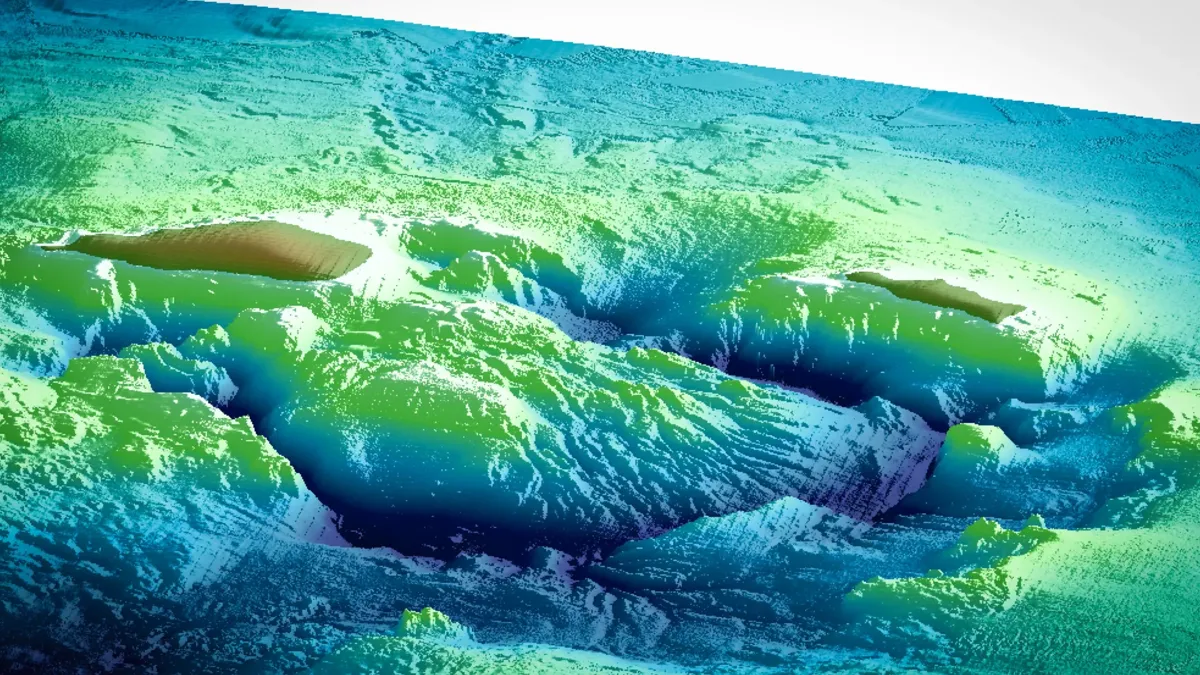
Kikai Supervolcano Is Refilling: What Seismic Waves Revealed
A 175 km seismic survey found a magma-rich zone under Japan's Kikai caldera, 7,300 years after its giant eruption. Here is how scientists saw it.
The research vessel Kaimei crawls along a straight 175-kilometre line across the sea floor, towing 24 airguns just ten metres below the surface. Every 200 metres or so the guns fire together, and a thump of compressed air at 2,000 pounds per square inch shoots down into the crust. On the bottom, 39 seismometers sit and listen. For most of the line the ship keeps shooting. Over one 20-kilometre stretch, in the middle, it does not: that is the part of the line that crosses a drowned crater.
The crater is the Kikai caldera in Japan, and what the ship was listening for is the thing that fills the space beneath it. About 7,300 years ago this volcano blew out one of the largest eruptions of the past 11,700 years. Ever since, geologists have wondered a simple question with a hard answer: where did all that magma come from, and is the volcano collecting more?
A team from Kobe University and the Japan Agency for Marine-Earth Science and Technology (JAMSTEC) now says it has an answer. Their seismic survey, published in Communications Earth & Environment in March 2026 and highlighted by Kobe University on 23 October 2026, shows a large, partly molten zone 2.5 to 6 kilometres beneath the caldera, at least as wide as the caldera itself. They argue that this is the same magma reservoir that fed the great eruption, now slowly refilled with fresh melt. We covered the announcement as it came out in our news report; here is the longer story of how the picture was made, what it does and does not show, and why the number "3 to 6 per cent" matters more than it sounds.
A Crater You Cannot Walk Around
A caldera is what is left when a volcano empties itself so fast that the ground above gives way. Magma leaves the reservoir in the crust, the roof loses its support, and a broad depression collapses into the space. The Kobe University release offers a way to feel the scale: the amount of magma released by the biggest eruptions would be enough to bury New York's Central Park under a layer roughly 12 kilometres thick.
Volcanologists give such eruptions a magnitude, defined in the paper as M = log10(m) – 7.0, where m is the erupted mass in kilograms. An eruption of 1014 kilograms, which the authors translate into 40 cubic kilometres of deposit at a bulk density of 2,500 kilograms per cubic metre, sits at M 7. Eruptions at or above that line, the authors note, are treated as a different class from the small mountain-building eruptions below M 5.7 that happen often: the way the magma is generated, accumulated and released appears to differ.
Kikai is firmly in the upper class. Its Kikai-Akahoya eruption, 7,300 years ago, released between 133 and 183 cubic kilometres of magma in dense-rock-equivalent terms, a figure that means the volume the magma would occupy if all the gas bubbles were squeezed out of it. The authors call it probably the largest eruption of the Holocene, the geological epoch that began about 11,700 years ago. Most of the caldera lies under the sea, which is both the reason it is hard to study and, as we will see, the reason it can be studied in an unusual way.
The eruption did not end the volcano's career. Inside the inner caldera there is a post-caldera central lava dome with a volume of more than 32 cubic kilometres, which the paper describes as the largest of its kind anywhere in the world. It was built by a different magma from the one that erupted in the catastrophe: a petrological study cited by the authors places its formation after 3,900 years ago, and the topography around it shows a double-caldera structure. A lava dome of that size is a leftover with a message. Something has been feeding this volcano since the eruption.
Why Anyone Needs to Look Inside
Volcanology is good at describing eruptions after the fact. Geologists map the deposits, measure how much material came out, and date it. From such surveys they have built "eruption cycle" models for giant caldera volcanoes. What those models struggle with is the long quiet stretch between catastrophes. How does a crust that has just lost a hundred cubic kilometres of magma gather a similar amount again? Is the old reservoir a ghost chamber, or is it refilled in place?
The Kobe team's argument is that the quiet stretch can be measured if you pick a volcano where the date of the last eruption and the volume of the missing magma are both well known. Kikai fits. So the question can be put quantitatively: how much melt is back under the caldera 7,300 years on?
Others have looked at giant volcanoes with seismic methods based on natural sources, such as earthquakes and the background hum of the Earth, called ambient noise. The paper reviews two well-studied cases. Beneath Yellowstone, whose last giant eruption formed the caldera 631,000 years ago and put out more than 1,000 cubic kilometres of rhyolite, tomographic images based on ambient-noise correlations show shear waves slowing by more than 30 per cent. The slowest zone, at depths of 3 to 8 kilometres, was estimated to hold 16 to 20 per cent partial melt. Beneath Toba in Indonesia, where the last giant eruption 74,000 years ago ejected around 5,300 cubic kilometres, a similar analysis found a shear-wave slowdown of more than 30 per cent, peaking at 5 to 11 kilometres, and a melt fraction of 14.5 to 18.5 per cent.
Both volcanoes, the authors point out, share one feature: a large magma reservoir at shallow depth, directly under the caldera. Neither of them, however, is a volcano whose last giant eruption is both recent and well dated. The only earlier large-scale seismic refraction survey after a recent big caldera-forming eruption was at Santorini in Greece, where the Minoan eruption 3,600 years ago released about 34.5 ± 6.8 cubic kilometres, slightly less than the 40 cubic kilometre threshold. There, surveys imaged a high-porosity column under the northern caldera basin, centred at 1.6 kilometres depth, and a magma body from 2.8 to 5 kilometres. Kikai's eruption was larger than Santorini's and older, which adds a second post-eruption case to a very short list.
Listening to the Crust
The method the team used is seismic refraction, and the idea is straightforward even if the processing is not. An airgun array on the ship fires a pulse of sound into the water. Part of that energy refracts down into the rock and returns as it bends through layers where waves travel faster with depth. Ocean bottom seismometers (OBS) on the sea floor record the arrival times of the pulse. If the rock below a seismometer is cold and strong, the waves arrive early. If it is hot, cracked or partly molten, the waves slow down and arrive late.
The team deployed 39 OBS along a 175-kilometre line crossing the volcano. Nine were placed just above the caldera at 2.5-kilometre spacing, where detail matters most; the other 30 were set outside the caldera, 5 kilometres apart. The R/V Kaimei, on cruise KM21-05, towed a 24-gun airgun array with a total capacity of 10,600 cubic inches, at 2,000 pounds per square inch and a depth of 10 metres, and fired about every 200 metres. The one exception was the stretch inside the caldera, between 78 and 98 kilometres from the western end of the line, where no pulses were generated. Satoru Tanaka was chief scientist of the cruise, and Akihiro Nagaya, Nobukazu Seama, Gou Fujie, Tanaka and Shuichi Kodaira collected the data.
This is where the sea becomes an advantage. A land-based team studying Yellowstone must work with the seismic stations and natural events they have. At Kikai, the researchers could lay out a regular array on the sea floor and generate their own sound source along the whole line. Seama puts it this way in the Kobe University release: "The underwater location allows us to implement systematic, large-scale surveys."
The raw material is a pile of seismograms. From the 38 OBS record sections, the team manually picked about 12,300 first arrivals, the moment when the first wave from each shot reached each instrument. They then applied first-arrival tomography, an inversion technique that adjusts a model of the crust until the travel times predicted by the model match the observed ones. The model has two layers, water and the rock below the sea floor, with the sea-floor shape taken from the survey's own bathymetry and a sound speed of 1.520 kilometres per second in water, fixed from temperature probes dropped during the cruise.
The starting model came from an earlier seismic line that obliquely crossed the area. It missed the observed travel times by an average of 632 milliseconds. After inversion, the RMS misfit fell to 64 milliseconds, and the chi-squared value, which compares the misfit with the uncertainty in each pick, was 0.87. A value near 1 means the model explains the data about as well as the picking error allows. The result is a two-dimensional map of how fast P-waves, the fastest and first-arriving seismic waves, travel through the crust beneath the line.
Four Provinces Along One Line
When the team sliced the velocity map into vertical profiles, the crust sorted itself into four regions, labelled A to D. In each, the velocity rises with depth, but at different rates: from the sea floor down, a steep climb gives way to a gentle one, and the change is progressively faster from Region A to Region D.
Outside A, the pattern makes geological sense. Region B, on the side of the Ryukyu Trench, has a velocity structure typical of island-arc crust. Region D, on the Okinawa Trough side, looks like oceanic crust. Region C is in between, and the authors read it as the transition from one to the other. The volcano sits in that transitional zone, and Region A, where the caldera is, is Region C with its velocity structure rewritten by the volcano's own activity.
Region A stands out most clearly at depths between 2 and 12 kilometres, where its mean P-wave velocity is lower than that of surrounding Region C. To quantify the difference, the team built a "background" profile by averaging the one-dimensional velocity structure along two stretches of Region C, one west of the volcano (60 to 77 kilometres along the line) and one east of it (100 to 110 kilometres), and subtracted it from the data. They left out everything shallower than 2 kilometres, because near the sea floor the velocity climbs so steeply that a tiny error in depth turns into a huge apparent anomaly.
What emerged was a trapezoid of slow rock directly under the volcano. Velocities there fall by more than 15 per cent below the background, and by as much as 22 per cent at the extreme.
From Slow Waves to Hot Rock
A slow zone is not yet a magma chamber. Many things slow seismic waves: heat, fractures, fluid-filled pores and melt. Turning a velocity map into a statement about magma takes assumptions, and the strength of this paper is that the assumptions are laid out in a short sequence the reader can follow.
The first assumption is about what is causing the slowdown at depth. At Santorini the low-velocity zone was interpreted partly as a high-porosity column created by collapse of the caldera floor. The Kikai authors accept that such a column might exist in the uppermost part but exclude it below 2 kilometres, citing petrological work on rhyolite dredged from the big lava dome, which estimated its magma depth at 2 to 4 kilometres. They also note that Kikai's central lava dome covers the whole inner caldera and leaves no basin, unlike the northern basin at Santorini. Below 2 kilometres, they assume, slowing comes only from temperature, up to the point where rock starts to melt, and only from melt above that.
The second step converts velocity to temperature. The paper assumes a background geothermal gradient of 40 kelvin per kilometre and a temperature derivative of velocity of −0.00018 per kelvin. That number, the average of laboratory experiments on granite heated to 500 °C, means that for each degree of heating, P-wave velocity drops by about 0.018 per cent. The team took 750 °C as the solidus, the temperature at which rhyolite starts to melt. By the time the rock has warmed to that point, the velocity has fallen by 5 to 10 per cent, depending on depth.
The authors are careful to say that temperatures computed above the solidus are not real: past that point most of the velocity drop is caused by melt, not heat, and the temperature map is only a bookkeeping device for separating the two effects.
From Hot Rock to Melt
Everything beyond the solidus slowdown is credited to melt. To convert slowness into a melt fraction, the team used an established formula for seismic velocities in a mixture of solid and liquid. Its input is the elastic stiffness and density of the host rock and of the liquid, plus one geometric parameter: the aspect ratio of the melt pockets. The authors used rhyolite values of K = 39.8 gigapascals for bulk modulus, G = 30.2 gigapascals for shear modulus and 2,371 kilograms per cubic metre for density, with the rhyolite melt at 13 gigapascals, no shear strength and 2,290 kilograms per cubic metre.
Geometry matters because a given amount of melt slows waves very differently depending on its shape. Melt in thin, flat films between grains is far more effective at softening the rock than melt in round blobs. The authors estimated the shape from experiments on basalt and peridotite, which show a maximum grain-boundary dihedral angle of 10 degrees; assuming the same for rhyolite gives an equivalent aspect ratio of 0.09.
With that choice, the arithmetic simplifies to a rule of thumb: the melt fraction is about half the velocity reduction. A drop of 6 per cent corresponds to 3 per cent melt, and a drop of 13 per cent corresponds to 7 per cent melt. In other words, the large anomalies on the map imply modest melt content. That is a very different thing from the popular picture of a lake of liquid rock.
It also explains why the authors use a specific threshold to draw the reservoir. The 10 per cent reduction needed to bring the rock to its solidus plus the 5 per cent reduction that equals 3 per cent melt makes 15 per cent. So they define the magma reservoir as the region with a velocity reduction of 15 per cent or more, meaning a melt fraction above 3 per cent and up to 6 per cent.
The Reservoir
Seen in cross-section, the reservoir sits at a depth of 2.5 to 6 kilometres, directly beneath the central lava dome. Approximated as a trapezoid, it has an upper base of 4 kilometres, a lower base of 13 kilometres and a height of 3.5 kilometres. Treating it as an axial object, a shape swept around a vertical axis, the authors calculate a volume of 220 cubic kilometres. They conclude that the reservoir is at least as wide as the inner caldera.
The melt fraction is 3 to 6 per cent, and the authors say it could be limited to 10 per cent at most. That is a rough guide, not a precise inventory, but a small calculation, ours and not the paper's, gives a sense of scale. Of 220 cubic kilometres, 3 to 6 per cent is roughly 7 to 13 cubic kilometres of liquid; even at the 10 per cent ceiling it is around 22. Both numbers are far below the 133 to 183 cubic kilometres that left the system in the eruption 7,300 years ago. The rest is crystalline or partly crystalline rock, hot enough to be soft but not free-flowing, the kind of body volcanologists often call a crystal mush.
The bulk of the reservoir is therefore not an eruptible pool. Nothing in the paper suggests it is ready to erupt, and the Kobe release is explicit on this point: the replenishment does not mean another catastrophic eruption is imminent.
Can We Trust the Picture?
Seismic tomography has a known weakness: it blurs. A sharp-edged feature in the crust comes out smooth in the model, and its peak value gets damped. The authors ran three tests to find out how much of their image is real.
- Checkerboard tests. They imposed alternating blocks of faster and slower rock, with a ±5 per cent velocity perturbation, in two sizes, and checked whether the inversion could recover them. The results showed that the structure under the volcano is resolved.
- Monte Carlo analysis. They varied the starting model many times to see how much the final answer depends on it. The low-velocity anomaly survived.
- Synthetic recovery tests. They inserted artificial low-velocity bodies of known size and strength and ran them through the same pipeline, to see what the survey would report.
The third test gave the most interesting result. The team tried four cases. A −15 per cent body, 12 kilometres wide and spanning 2.5 to 6 kilometres depth, came back with a −15 per cent region notably smaller than the one seen in the real survey. A −30 per cent body of the same size also came back too small, and so did a −15 per cent body widened to 18 kilometres and deepened to 6.5 kilometres. Only when the team put in a stronger anomaly (−20 per cent) over that broader area did the recovered shape resemble what the real survey saw. The implication, in the authors' words, is that the actual reservoir is larger and has a greater melt fraction than the one they estimated. The figures in the paper are therefore a floor, not a ceiling.
The authors are open about the weak points. They tried a range of background geothermal gradients from 30 to 50 kelvin per kilometre and found no notable difference. The solidus temperature, which depends on the water content of the rhyolite, has only a slight effect: lower solidus gives a bigger reservoir with more melt. The big uncertainty is the temperature derivative of velocity. Change it and the reservoir's size and total melt volume change a lot, which, they concede, may prevent an exact figure even though the value they used comes from laboratory work. Despite that, they argue that three conclusions hold: a large reservoir exists at 2.5 to 6 kilometres, its width is at least that of the inner caldera, and its melt fraction of 3 to 6 per cent is a robust number.
One more caveat is built into the geometry. The survey is a single line, so the reservoir is only seen in a two-dimensional slice. The 220 cubic kilometres figure depends on the assumption that the shape is rotationally symmetric. A three-dimensional survey could change it.
The Same Room, New Magma
With a reservoir in hand, the team asked what it says about history. They built what they call a melt re-injection model, which rests on two assumptions.
The first is that the magma reservoir that fed the Kikai-Akahoya eruption was in the same place as the one imaged today. The case rests on three points. The present reservoir is at least as wide as the inner caldera and lies beneath it, which explains why the ground subsided: that is what happens when magma is withdrawn from a reservoir right underneath. The depths match too. The imaged reservoir sits at 2.5 to 6 kilometres, the petrological estimates for the great eruption are 3 to 7 kilometres, and for the central lava dome 2 to 4 kilometres. And the eruption was so big, around 160 cubic kilometres, that a second giant reservoir for it could not have been tucked away beside the present one.
The second assumption is that new melt has been added to that same reservoir since. Here the evidence is chemical. The rocks of the central lava dome, and of later activity other than a small eruption of the old Iwo-dake stage between 5,200 and 3,900 years ago, differ in composition from the products of the giant eruption. A different composition means a different source. In the Kobe summary, Seama says: "This means that the magma that is now present in the magma reservoir under the lava dome is likely newly injected magma."
Put together, the story runs in four phases. The first is the eruption itself, 7,300 years ago, when about 160 cubic kilometres left the reservoir and the caldera began collapsing during the eruption. The second is the aftermath, with a double-caldera structure in place and the state of the reservoir, in the paper's words, uncertain. The third is the period since 3,900 years ago, in which a different magma built the central lava dome, more than 32 cubic kilometres of it. The fourth is today: a reservoir with a few per cent melt.
The minimum arithmetic is simple. At least 32 cubic kilometres of new melt reached the surface over 3,900 years, and that yields an injection rate of more than 8.2 cubic kilometres per thousand years. The authors stress that this is an average. The supply may have been continuous, or it may have come in episodes at some time in the last 3,900 years. What they say about the present state is that the added melt raised the melt fraction in the reservoir, while the dome formed as melt pushed up the volcanic body and was erupted onto the surface.
Seama is direct about the reservoir's identity: "Due to its extent and location it is clear that this is in fact the same magma reservoir as in the previous eruption."
Kikai Among the Giants
The authors propose that melt re-injection into the same shallow reservoir may be a common feature of volcanoes that have gone through a large or giant caldera eruption. They go through the other examples to check whether depths match, and the results are suggestive.
- Yellowstone. The large reservoir sits at 3 to 8 kilometres with 16 to 20 per cent melt, and the depth overlaps petrological estimates for where the erupted rhyolite bodies were assembled, at 3 to 6 kilometres.
- Toba. Petrology of the 74,000-year-old Toba Tuff suggests the magma resided at nearly water-saturated pressures of 100 to 150 megapascals, which is 4 to 6 kilometres depth; the shear-wave slowdown beneath the caldera runs from 5 to 11 kilometres. The authors say these might match.
- Santorini. The magma body imaged at 2.8 to 5 kilometres lies at the same depth as the pre-eruptive storage of Kameni Island lavas, which melt-inclusion studies constrained.
"This magma re-injection model is consistent with the existence of large shallow magma reservoirs beneath other giant calderas like Yellowstone and Toba," says Seama.
It is worth being careful with these comparisons. The Kikai figure of 3 to 6 per cent melt looks small next to 16 to 20 per cent for Yellowstone and 14.5 to 18.5 per cent for Toba, but the numbers come from different methods. The Kikai study measured compressional P-wave velocities in a refraction survey, assumed a melt shape, and defined the reservoir by a threshold. The Yellowstone and Toba figures come from shear-wave tomography built from ambient noise. They have different sensitivity to melt and different resolution, and the paper does not claim that Kikai is less molten than its cousins. What it claims is a pattern of shallow, wide, partly molten storage, one that repeats at several volcanoes.
What This Does and Does Not Say About the Next Eruption
A paper about a supervolcano filling up invites a single question, and the researchers have clear words about it. The Kobe University release says the replenishment "does not mean that another catastrophic eruption is imminent"; rather, it shows how a magma reservoir can be recharged over thousands of years, a process that scientists need to understand before they can assess the long-term behaviour of such volcanoes.
The paper's own wording is a little more forward-looking. In the final paragraph, the authors write that melt re-injection into a reservoir at shallow depth just beneath the caldera "could be a step towards the next giant caldera eruption", and that observations of the seismic velocity reduction and of its changes are important indicators of subsequent giant caldera eruptions. Read carefully, this is a statement about what to watch, not a forecast. One snapshot cannot say how fast the reservoir changes. To say that, you need a second survey, years later, along the same line.
It is also worth being clear about what a 3 to 6 per cent melt fraction implies physically. Magma that is mostly crystals and has only a thin web of liquid is hard to mobilise. A reservoir of this kind needs time, heat and further melt supply before it contains enough eruptible liquid. The paper does not model that process, and it does not try to tell when, or whether, the threshold would be reached.
What Comes Next
The next step is to see the reservoir better. The team says it wants to refine the methods used in the study to understand the re-injection process in more detail. The goal, as the Kobe University release puts it, is "to become better able to monitor the crucial indicators of future giant eruptions."
Several of the paper's own limitations suggest where improvements would come from. A three-dimensional survey, with crossing lines rather than a single transect, would show whether the reservoir is really symmetric around the dome. Repeated surveys could show whether the velocity anomaly changes over years. Better laboratory values for how rhyolite and its melt behave could shrink the main uncertainty, the temperature derivative of velocity. And the same experiment at other submarine calderas would test whether Kikai is typical or special.
For readers, the wider lesson is that the quiet interval between giant eruptions is not empty. The crust beneath a collapsed caldera keeps working: heat rises, new melt arrives, and a lava dome grows on the surface as a visible sign of what is happening below. Kikai was a particularly good place to see this, partly because the eruption was so huge and so well dated, and partly because the sea allowed scientists to lay out an instrument array and a sound source on a scale that is hard to arrange on land.
More of our coverage of earth-science discoveries is in the Science section, and related stories are collected under the volcanology tag.
Sources
- Nagaya, A., Seama, N., Fujie, G., Tanaka, S., Sugioka, H. & Kodaira, S. "Melt re-injection into large magma reservoir after giant caldera eruption at Kikai Caldera Volcano." Communications Earth & Environment 7 (2026). DOI: 10.1038/s43247-026-03347-9 (open access).
- Kobe University, "One of Earth's most powerful supervolcanoes is refilling with fresh magma," ScienceDaily, 23 October 2026: sciencedaily.com.